
Abstract
A new simple method for determining the transition to supercritical state in a flow-type isobaric setup has been proposed and validated on water–ethanol mixtures with EtOH molar fractions of 0.22, 0.78 and 0.85. Experimental pseudocritical parameters agree well with those calculated by Peng–Robinson equation of state.
Keywords
Communication
A supercritical fluid (SCF) is a state of the substance when the temperature and pressure exceed the critical values, Tc and Pc. Above this point, a substance can not exist in a liquid state, the distinction between liquid and gas disappears, and as the temperature and pressure increase the fluid density changes continuously.[1, 2] SCFs are useful for chemical processing. Their density is often comparable to that of liquids, whereas their viscosity and diffusivity are closer to those of gases. As a result, they can provide high solvent power together with enhanced mass transfer and penetration into porous materials.[3-5] Thus, SCFs are attractive as solvents, extractants, and reaction media,[6-10] including catalytic processes.[11, 12]
The practical use of SCFs requires reliable determination of the parameters where the transition to the supercritical state occurs. Near the critical point, small changes in temperature or pressure can cause large changes in density and solubility.[2, 13, 14] For pure substances, the critical parameters are well established.[15] For mixtures, however, the transition region depends on composition and should not be determined from mixing rules or equations of state. Experimental methods for determining the pseudocritical parameters of water–organic mixtures have been reported.[16, 17] However, they are mainly developed for static or isochoric conditions, whereas industrial processes are often carried out in flow systems under isobaric conditions. The aim of our work was to develop and test a rapid experimental method for determining the transition to the supercritical state in isobaric flow setup. Water–ethanol mixtures with ethanol mole fractions of 0.22, 0.78, and 0.85 were used as model systems. Water–ethanol mixtures are of particular interest for the processing of renewable plant raw materials, specifically, lignin.[18, 19]
Methodologically, the transition of ethanol–water mixture to supercritical state is possible in two ways (Figure S1, Online Supplementary Materials): first, under normal conditions, the substance is heated at a constant pressure to a temperature T1 > Tc, then the substance is compressed to a pressure P1 ≥ Pc; second, the substance is compressed at a temperature T0 (T0 < Tc) to a pressure P1 ≥ Pc and then heated to T1 > Tc at a constant pressure. Inasmuch as our aim was to reproduce the isobar flow conditions, we used the second way to achieve the supercritical state.
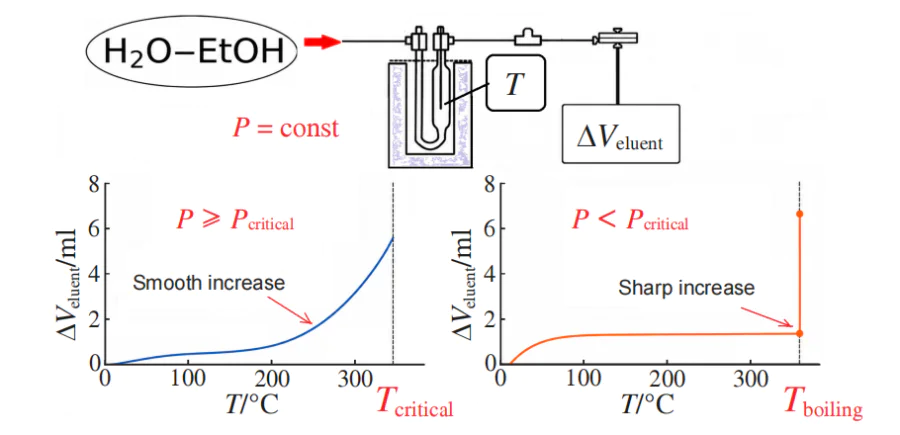
The scheme of the experimental flow-type setup is shown in Figure S2 (Online Supplementary Materials). The mixture was first compressed with high-pressure syringe pump and then at constant pressure was heated in the flow U-type reactor. The water–ethanol mixture leaving the reactor was collected in a trap, and the volume of the collected eluent was measured at 10-min intervals. The change in the volume of the collected eluent reflects the change in the fluid density in the reactor. The entrance to supercritical state can be determined from the temperature dependence of the eluent volume at constant pressure. At pressure below the critical (for pure substances) or pseudocritical (for mixtures) ones, heating caused a jump in the eluent volume, which was attributed to a first-order liquid–vapour transition. For a mixture of the substances under pressures exceeding the pseudocritical value, there is no phase boundary between the liquid and gas states; therefore, the transition to the supercritical region is experimentally determined by the disappearance of a sharp change in the eluent volume and the appearance of an isothermal plateau on the time curve of the reactor temperature. The continuous transition to the supercritical state corresponds to a second-order phase transition, during which the eluent volume and the reactor temperature change smoothly as the system is heated.
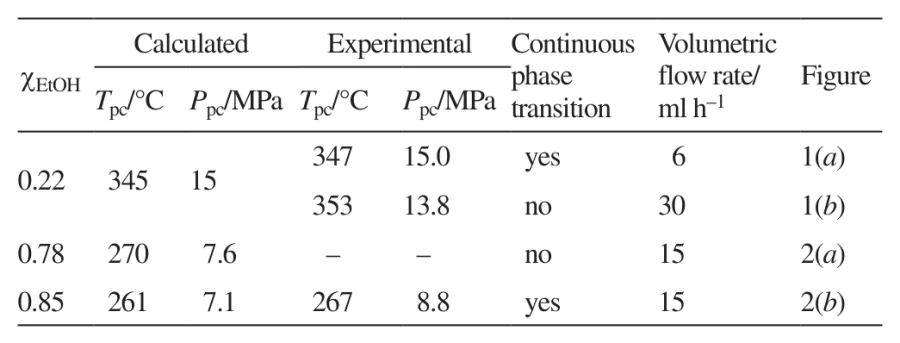
Figure 1 shows the set of the parameters (the heater temperature, inner temperature and pressure inside the reactor, and the eluent volume) describing the phase behavior of the water–ethanol mixture of χEtOH = 0.22 (χ is molar fraction) at different flow rates. There is a correlation between the temperature in reactor and the eluent volume. In Figure 1(a), at a temperature of 347 °C, there is a bend in the reactor temperature curve with a simultaneous smooth and gradual increase in eluent volume curve, which indicate the second-order (continuous) phase transition. The transition occurs at pressure of 15.0 MPa corresponding to the critical value. In Figure 1(b), there is an isothermal plateau on the reactor temperature curve at 130 min after beginning the experiment and the simultaneous jump in the eluent volume. This is an indication of the first-order phase transition. In this case, the pressure measured is 13.8 MPa, which is slightly lower than the calculated critical value.
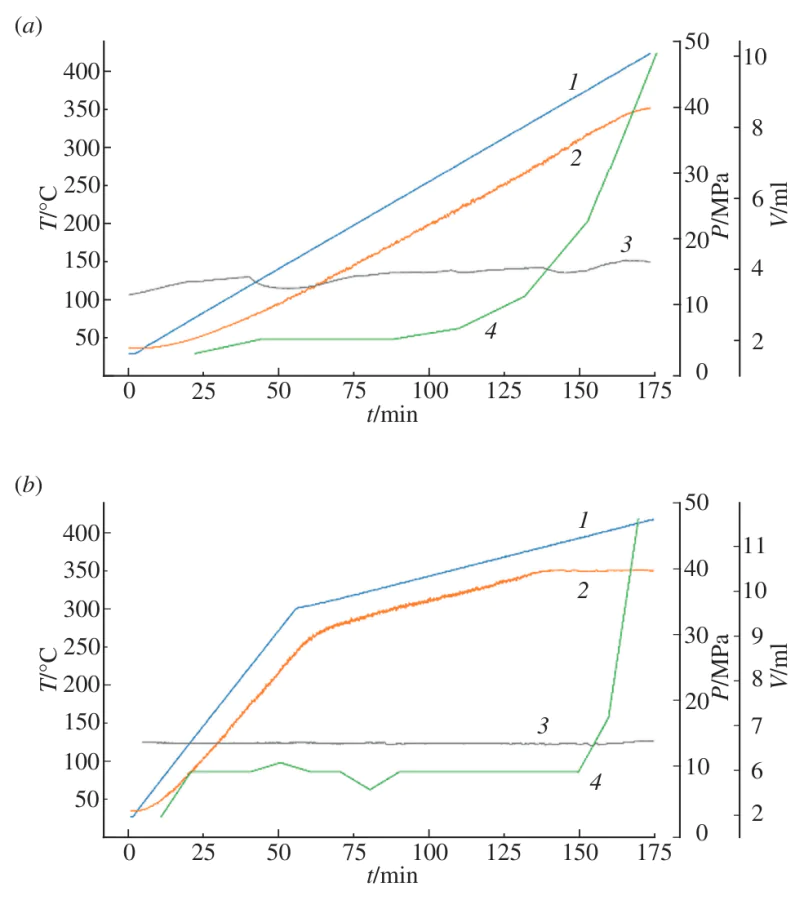
The flow rates should be empirically selected. The flow rate affects the residence time and heat transfer in the heated reactor, as well as pressure stability. At high flow rates, the residence time of the mixture in the reactor becomes insufficient to achieve the required temperature. Conversely, at too low flow rates, it is impossible to maintain a stable pressure in the reactor. The effect of flow rate is illustrated by the behavoir of the mixture with χEtOH = 0.22 in Figure 1: at the flow rate of 6 ml h–1, the continuous transition to the supercritical state was observed near 347 °C and 15.0 MPa [see Figure 1(a)], whereas at 30 ml h–1 the mixture remained subcritical even at 353 °C because of insufficient heating [see Figure 1(b)]. Besides, the applicable flow-rate range is apparatus-dependent. Therefore, an appropriate flow-rate range providing both sufficient heating and stable pressure should be established for a particular reactor configuration before applying the proposed method.
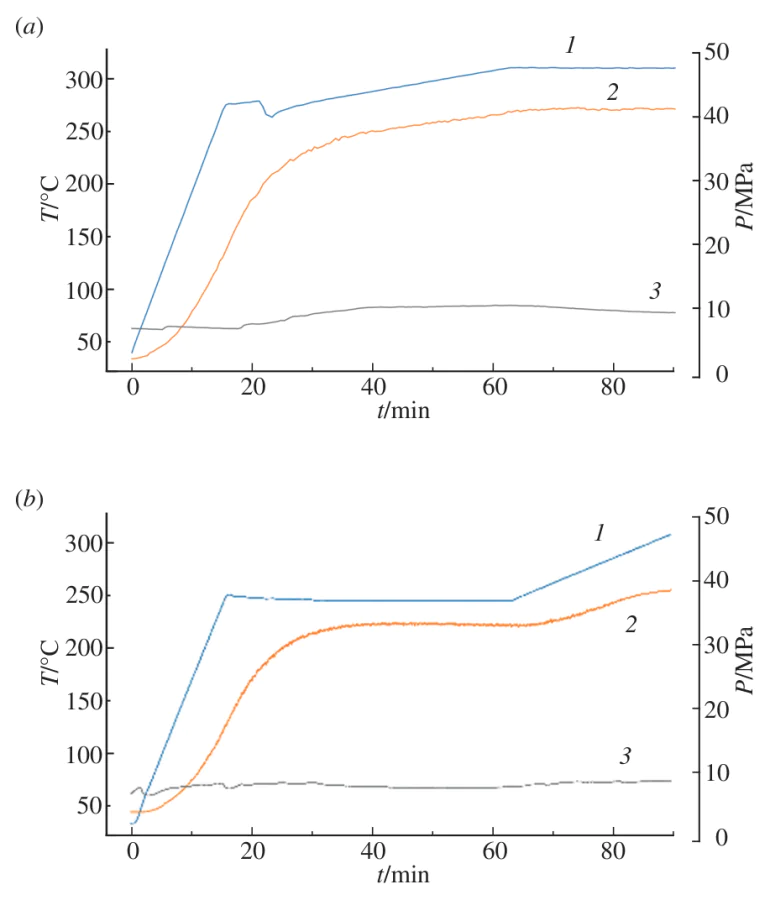
Time dependence of the reactor temperature during heating serves an additional indicator of phase transition. Under the first-order phase transition, a temperature plateau is formed, and under the continuous phase transition, the temperature in reactor increases with heating. Figure 2 shows the experimental curves for the mixtures of χEtOH = 0.78 and 0.85 at flow rate of 15 ml h–1: the heater temperature, and the temperature and the pressure inside the reactor. In Figure 2(a), for the mixture of χEtOH = 0.78, isothermal plateau on the reactor temperature curve indicates the first-order phase transition. In Figure 2(b), for the mixture with χEtOH = 0.85, the bend on the reactor temperature curve at 60 min after beginning the experiment indicates a second-order phase transition. The corresponding temperature is pseudocritical temperature for the mixture of χEtOH = 0.85.
Thus, our method allows one to experimentally distinguish the first-order liquid–vapour transition from the continuous second-order transition to the supercritical state. A jump in the eluent volume under heating reactor indicates a first-order phase transition. During the second order (or continuous) phase transition, when a water– ethanol mixture is in a supercritical state, a smooth increase of the eluent volume occurs.
The Peng–Robinson equation of state,[20] implemented in the COCO simulator software package,[21] was used to compare pseudocritical calculated parameters of water–ethanol mixtures with experimental (Table 1). Preliminarily, using the Peng–Robinson equation of state, the behavior of pure individual substances was theoretically described and verified by calculations using the IAPWS95[22] (for water) and IUPAC[23] (for ethanol) equations of state (Online Supplementary Materials, Figure S3 and S4, Table S1). The equations and details of the calculation procedure are given in the Online Supplementary Materials. The calculation of the pseudocritical parameters of ethanol–water mixtures can help choosing the conditions necessary for observing the transition to supercritical state (Online Supplementary Materials, Figure S5, Table S2), and for simplicity of the calculation the mixtures can be considered as ideal. The consistency of the calculated and experimental pseudocritical parameters in the Table 1 proves the applicability of such simplification. For mixture of χEtOH = 0.85, the density isobar (9.0 MPa) created from the experimental data and calculated one using the Peng–Robinson equation of state were compared (Figure S6, Online Supplementary Materials). The deviation between curves does not exceed 5%. Both curves are smooth, which is consistent with the transition to supercritical state at parameters above the critical (Tpc = 267 °C and Ppc = 8.8 MPa).
Our pseudocritical parameters agree very well with those obtained for mixtures with the similar concentrations of ethanol (Online Supplementary Materials, Table S2).[24] The deviations do not exceed 5%, which is a relative error of the experiment. There is much more discrepancy with the data obtained for the deuterated water–ethanol mixture with χEtOH = 0.2 (Online Supplementary Materials, Table S3).[25] The critical temperature of the deuterated mixture is nearly 40° lower, and the critical pressure is also 1.5 MPa lower. Such discrepancies emphasize the importance of the method for rapid and simple experimental determination of pseudocritical parameters of water–organic mixtures.
Thus, a new experimental method was developed for indicating the transition of water–ethanol mixtures to the supercritical state under flow isobaric conditions. The method based on monitoring the volume of the eluent at constant pressure during heating. We observed a significant difference in the temperature – eluent volume dependence for the first- and the second-order phase transitions. The criterion of the continuous phase transition (second-order) is a smooth changing the eluent volume. In contrast, the first-order phase transition is accompanied by a sharp jumping the eluent volume. Time dependence of the temperature in reactor is an additional indicator of phase transition during heating. Under the first-order phase transition, a temperature plateau is formed, and under the second-order phase transition, the reactor temperature smoothly increases with heating. In a series of repeated experiments, the results were reproduced (Online Supplementary Materials, Figures S7–S9).
The proposed method was tested for water–ethanol mixtures and might be considered as a rapid experimental approach for detecting the transition to the supercritical state under flow conditions for others water–organic mixtures; however, preliminary experimental validation is required. Researching flow regimes, transfer coefficients, and mapping flows at near-and supercritical area are complicated tasks.[26] The flow rate is an apparatus-dependent parameter that affects residence time, heat transfer, and pressure stability. Therefore, the method proposed should be developed for a given setup configuration in each specific case with the selection a flow-rate range that provides sufficient heating and stable pressure.
References