
Abstract
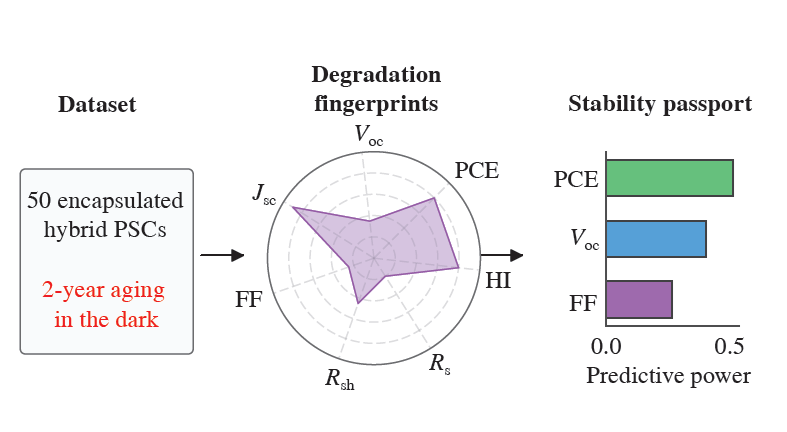
We introduced a new concept for evaluating the operational stability of hybrid perovskite solar cells (PSCs) based on multi-parameter ‘radar mapping’, which integrates key device performance metrics into a unified visual and numerical profile. A systematic analysis of high-efficiency encapsulated PSCs aged in the dark for over two years, during which highly stable devices retained 94% of their initial efficiency with minimal parameter degradation, revealed that long-term stability is fundamentally predetermined by the initial diode quality while pristine parameters of cell effectiveness, open-circuit voltage and fill factor are statistically significant predictors of PSC stability. To build a ‘Stability passport’ for the PSCs, these physical observations were formalized using linear regression standardized via machine learning.
Keywords
Communication
Over the past decade, hybrid organic–inorganic perovskite solar cells (PSCs) have achieved an unprecedented breakthrough in photovoltaics,[1] reaching a certified power conversion efficiency (PCE) exceeding 26%.[2] A combination of exceptional optoelectronic properties, such as a high absorption coefficient, long charge-carrier diffusion length and tunable bandgap, makes them the most promising alternative to traditional silicon-based technologies.[3] However, despite such high efficiency, insufficient long-term stability remains a critical obstacle to their large-scale deployment.[4]
Perovskite layers are highly sensitive to moisture, oxygen, ultraviolet radiation and thermal stress, leading to chemical degradation and the subsequent loss of device functionality.[5-9] To systematize stability research, the international community established the International Summit on Organic Photovoltaic Stability (ISOS) protocols, which have recently been adapted for perovskite-based devices.[10] Specifically, the ISOS-D (Dark storage) protocols focus on degradation in the dark, enabling the evaluation of the fundamental chemical and structural stability of materials in the absence of photo-induced processes.
A profound understanding of degradation mechanisms requires a detailed analysis of the evolution of current–voltage (J–V) characteristics during storage. Key indicators of ‘device health’ include either the PCE or the parameters defining the shape of the J–V curve: open-circuit voltage (Voc), short-circuit current density (Jsc) and fill factor (FF). Furthermore, monitoring changes in series resistance (Rs) and shunt resistance (Rsh) during aging enables the localization of defects arising at interfaces or within the perovskite bulk.[11] Additionally, the J–V hysteresis index (HI), driven primarily by ion migration, serves as a crucial marker of structural instability.[12]
This report presents, for the first time, a comprehensive approach to analyzing ‘device passports’ for hybrid PSCs. We investigate a series of 50 encapsulated samples, each with an initial PCE exceeding 15%, over an extended period, following the ISOS-D protocols and employing ‘radar parameter mapping’ and statistical correlation analysis. The proposed methodology enables the visualization of each physical parameter’s contribution to overall device degradation and the identification of the most vulnerable components within a specific solar cell architecture.
All analyzed data were obtained from a series of perovskites with the composition (MA0.019Cs0.05FA0.931)Pb(I0.98Br0.02)3, where MA and FA denote methylammonium and formamidinium cations, respectively. This mixed-cation and mixed-anion composition is known to be among the most promising, offering superior efficiency and relatively high stability.†[13] All devices investigated in this study were fabricated using a uniform method and featured a p-i-n (inverted) architecture with the following sequence of functional layers: ITO/PTAA/(MA0.019Cs0.05FA0.931) Pb(I0.98Br0.02)3 + MACl (30 mol% excess)/C60/BCP/Cu/encapsulation material/cover glass, where ITO and PTAA stand for indium tin oxide and poly[bis(4-phenyl)(2,4,6-trimethylphenyl) amine], respectively. Following fabrication, all devices were encapsulated according to the described procedure[14] and stored in the dark at 25 °C in compliance with the ISOS-D protocol. J–V characteristics were regularly measured using standardized solar simulators reproducing the global horizontal irradiance spectrum (AM1.5G) with a light power density of 100 mW cm−2.[10]
† (FA0.98MA0.02)0.95Cs0.05Pb(I0.98Br0.02)3 films were prepared from stoichiometric precursor solutions of formamidinium iodide, formamidinium bromide, methylammonium iodide, cesium iodide (CsI), lead bromide (PbBr2) and lead iodide (PbI2), with 30% excess of methylammonium chloride,[15] in a 4 : 1 (vol/vol) mixture of N,N-dimethylformamide and dimethyl sulfoxide via a one-step antisolvent spin-coating in an inert glovebox, followed by annealing for one hour at 125 °C.[16]
Selecting a dataset comprising 50 identical devices is crucial for ensuring the statistical validity of the results. Although many published studies utilize smaller batches (typically 5–10 samples),[10, 17, 18] such a limited scale often fails to capture the true distribution of failure modes, leading to overestimated stability. In our study, a dataset of 50 encapsulated PSCs provided a sufficient statistical basis to distinguish between systematic trends and stochastic outliers. To ensure robust characterization of long-term degradation kinetics, the photovoltaic parameters of all fabricated devices were systematically monitored over two years of storage in the dark. Rather than traditional relying on a baseline and a final measurement, we collected and analyzed extensive data for each solar cell, including comprehensive J–V testing at six-month intervals, thereby obtaining four complete sets of operational data points per device, including the pristine state. Characteristic T80 lifetime metrics were subsequently derived from these multi-point aging kinetic profiles using non-linear interpolation to avoid the errors inherent in standard two-point linear extrapolation.
To elucidate the dominant failure modes of the PSCs in our sample during long-term dark storage, four representative scenarios were identified based on their distinct degradation fingerprints (Figure 1). Scenario A demonstrates superior intrinsic stability; scenario B is characterized by signs of bulk layer degradation accompanied by significant shunting; scenario C reflects localized contact failure and increased interfacial resistance; scenario D illustrates transport losses and current collection decay. All parameters are normalized to their initial values for fresh devices; for series resistance (Rs) and the hysteresis index (HI), a penalty-based scaling was applied, whereby a decrease in value (a shift toward the center of the diagram) represents a loss in device quality (i.e., an increase in the absolute values of Rs or HI). Changes in the shape of the petals on the radar chart indicate specific physicochemical processes occurring within the PSC. To strengthen the radar observations and provide clearer guidance for the reader, the exact pristine photovoltaic parameters (PCE0, Voc,0, Jsc,0, FF0, Rs,0 and Rsh,0), averaged for each degradation scenario along with their respective standard deviations, are summarized in Table S1 (see Online Supplementary Materials).
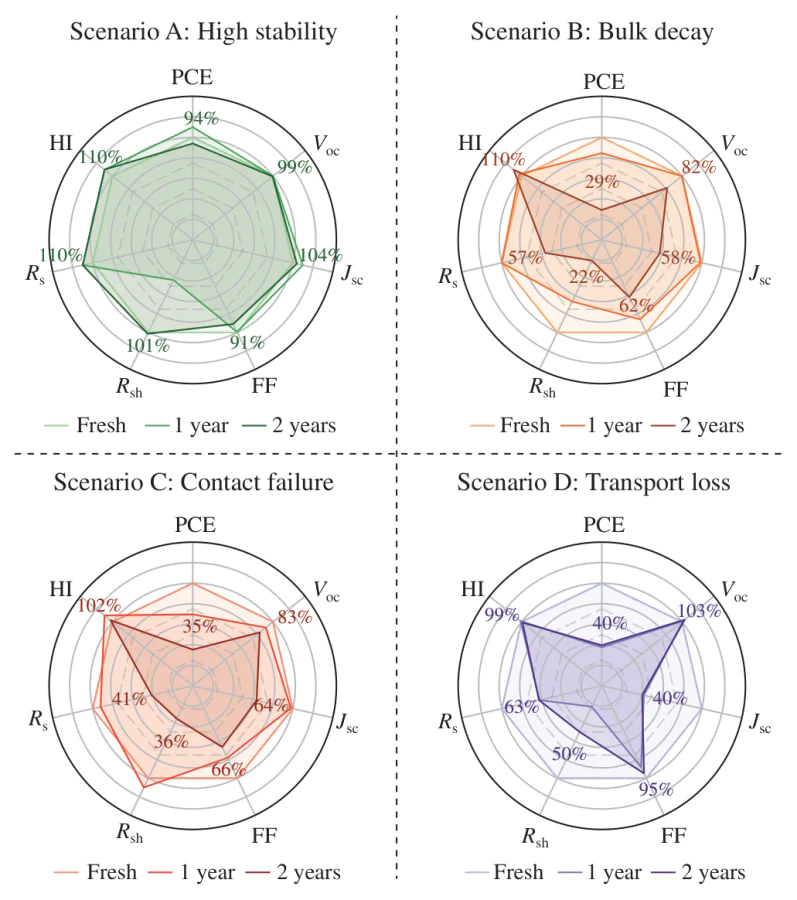
Scenario A (high intrinsic stability) corresponds to the upper limit of the investigated architecture’s durability. The sample representing Scenario A retains 94% of its initial PCE after two years of storage in the dark. The near-perfect overlap of the profiles obtained at different time points (from the initial state to two years) demonstrates the exceptional chemical stability of the perovskite layer and the robustness of the selective contacts. The preservation of Voc and Rsh values indicates a negligible increase in the concentration of non-radiative recombination centers and the absence of shunt formation over time.
The sample corresponding to scenario B (shunting and bulk recombination) illustrates a ‘bulk-driven’ failure mode. The radar chart shows a significant contraction, primarily along the FF, Rs and Rsh axes (retaining only 62, 57 and 22%, respectively), while Voc retained 82%. The drastic drop in Rsh correlates with increased leakage currents, whereas the partial losses in Voc and Jsc possibly points to a rising density of deep-level traps within the perovskite lattice and a decrease in the volume of photoactive material, respectively. In contrast to the ‘bulk-driven’ failure mode, the sample from Scenario C (interface and contact failure) exhibits asymmetrical ‘interface-driven’ degradation. Although the Voc and Jsc remain relatively high (retaining 83 and 64%, respectively), the device suffers from a critical deterioration of Rs and Rsh (quality drops to 41 and 36%, respectively) and a subsequent collapse of FF. It should be noted that the classification of devices into scenarios A–D is based essentially on a phenomenological analysis of J–V curve profiles. Although direct microstructural and phase-related evidence (such as cross-sectional SEM, XRD or EDS interface mapping) was not collected for the aged devices, scenarios B and C exhibit electrophysical signatures largely characteristic of bulk perovskite degradation and interface-dominated recombination decay, respectively. To maintain scientific rigor, these categories should be interpreted as potential degradation pathways suggested by the macroscopic parameters variance, rather than as unequivocally proven structural transformations.
Scenario D (light harvesting and charge transport losses) represents a mixed degradation mode, dominated by current losses. The primary contraction occurs along the Jsc and FF axes. This ‘slimming’ of the radar chart, while Voc remains moderately stable, points to a reduction in the effective light-harvesting area or the formation of transport barriers in the charge-selective layers. This behavior might be caused by partial chemical decomposition of the hybrid perovskite at the interfaces, which leads to the extraction of charge carriers without shunting and device failure.
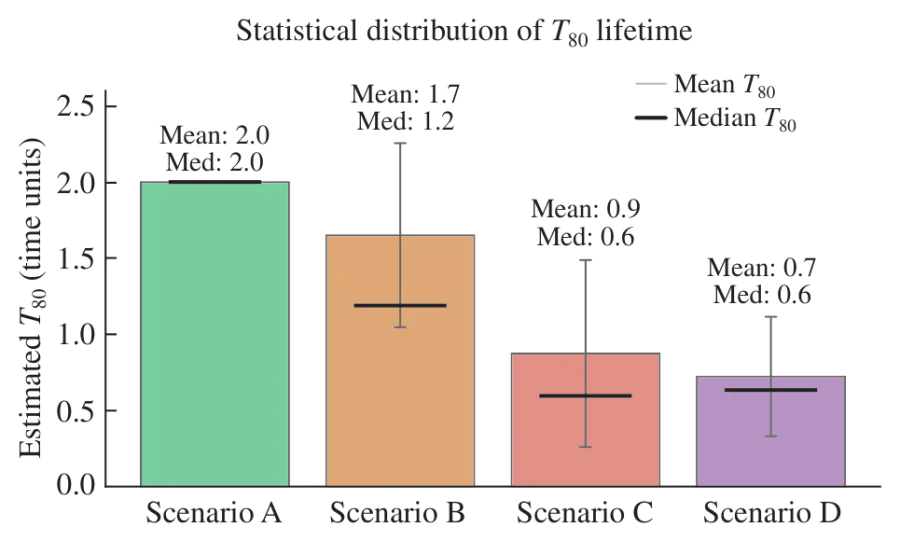
To quantify the impact of the observed degradation modes on device stability, the average T80 lifetime (the time required for the PCE to decrease to 80% of the initial value) was calculated for each scenario (Figure 2). The statistical distribution reveals a clear stability hierarchy, in which the degradation pathway is largely predetermined by the initial device pristine performance parameters. Maximum stability is observed in scenario A, while scenarios B (bulk decay), C (contact failure) and D (transport losses) are characterized by significantly shorter lifetimes. The notable discrepancy between the mean and median values in scenario B (bulk decay) highlights a skewed distribution due to the presence of samples with rapid degradation driven by internal shunting mechanisms.
A key finding of this study is the strong correlation between initial photovoltaic parameters and the long-term stability of PSCs. Correlation analysis identified three most valuable predictors of device lifetime: initial PCE0, Voc,0 and FF0. Initial PCE itself serves as the primary predictor of stability. In this context, a high PCE value is not merely a performance metric but a comprehensive indicator of the device’s overall integrity. Devices exhibiting superior initial power output are significantly more likely to follow scenario A (high stability); this suggests that the same factors that maximize energy conversion, such as high-quality perovskite crystallization and optimized energy-level alignment, also provide a robust barrier against degradation. The initial voltage serves as a direct proxy for the density of non-radiative recombination centers. A high Voc,0 value indicates that the pristine device possesses highly passivated interfaces and grain boundaries. Our data show that devices with lower initial voltage are prone to scenario B (bulk decay), as pre-existing defect sites at the very beginning likely act as the origin for the subsequent chemical decomposition of the perovskite lattice.
The initial FF, serving as an indicator of the balance between shunt and series resistances, reflects the efficiency of charge extraction. A high FF0 ensures the efficient removal of charge carriers from the perovskite layer, thereby slowing down electrochemical reactions at the interfaces. Consequently, devices with a poor initial FF tend to exhibit rapid transport losses (scenario D), confirming that the quality of the ‘pristine’ interfaces is a decisive factor for the multi-year durability of the cell.
These initial characteristics effectively serve as ‘health indicators’ for perovskite cells. The statistical evidence suggests that the longevity of a device is often ‘programmed’ during the fabrication stage: a high-quality initial diode configuration (Voc and FF) is the most reliable guarantor of long-term resistance to environmental and internal stress.
To identify the most reliable indicators of the stability of our PSCs during long-term dark storage, we performed a Pearson correlation analysis between the initial photovoltaic parameters (s0) and the estimated T80 lifetime. The calculated correlation coefficients (r) and their corresponding p-values are presented in Figure 3. The parameters PCE0 and Voc,0 exhibit a statistically significant positive correlations, identifying them as primary ‘health indicators’ for long-term stability. A pronounced positive trend is observed for the FF0 parameter (p = 0.054), whereas Rs,0 and HI0 show no statistical significance within this dataset, suggesting that the initial quality of the perovskite layer is the decisive factor for PSC lifetime. The weak positive correlation for HI0 is statistically insignificant (p > 0.05) and likely represents a concomitant dependency linked to high initial photovoltage.
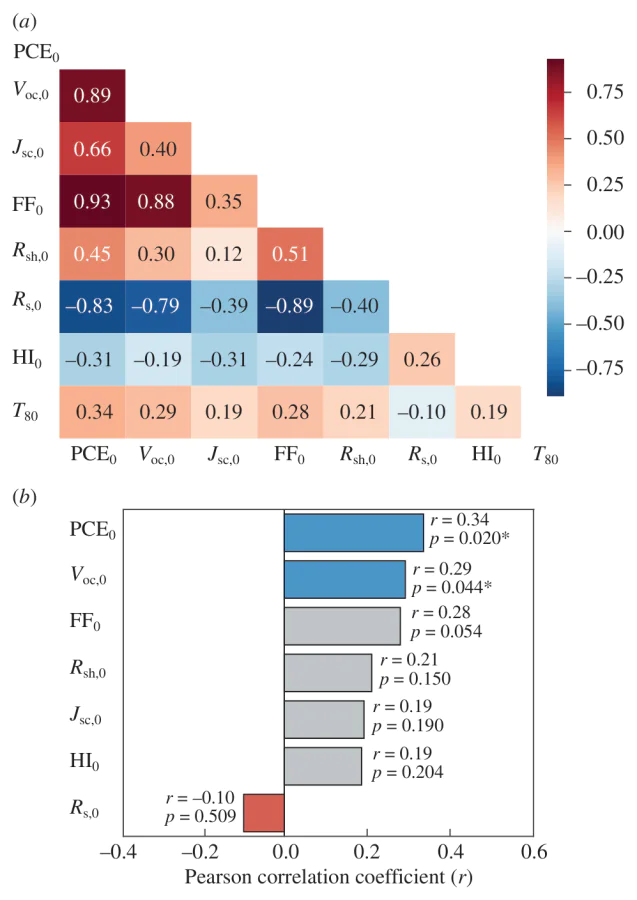
The analysis reveals that the initial PCE (PCE0) and open-circuit voltage (Voc,0) are the only parameters showing a statistically significant positive correlation with device stability (r = 0.34, p = 0.02 and r = 0.29, p = 0.044, respectively). The significant role of PCE0 as a primary predictor suggests that high initial performance is a direct proxy for overall structural and electronic integrity. More specifically, the strong correlation with Voc,0 underscores the critical importance of suppressing non-radiative recombination at the pristine stage; devices with lower initial voltages likely possess a higher density of interfacial defects, which act as nuclei for subsequent chemical degradation, leading to scenario B (bulk decay) observed in our study.
The fill factor (FF0) shows a similar positive trend (r = 0.28), although its significance level (p = 0.054) is slightly above the generally accepted threshold of 0.05. This suggests that while the initial charge extraction efficiency and contact quality (associated with scenario C) contribute to stability, their predictive power is secondary to the quality of the perovskite absorber itself (represented by Voc).
According to our standardized linear regression analysis, a device with a lower initial Voc of 1.0 V will degrade faster. Originally, a lower pristine Voc indicates a higher density of trap states and more pronounced nonradiative recombination channels at the interfaces. Over two years, these initial defects accelerate chemical and structural degradation, leading to a rapid decline in performance. Conversely, a high initial Voc,0 (1.3 V) reflects excellent interface passivation and high diode quality, which fundamentally predetermines superior long-term stability. Since our ‘Stability Passport’ model includes standardized coefficients [extracted from Figure 3(b)] to compare the relative impact of different parameters on the same scale, the exact mathematical prediction for the residual PCE metric ΔPCEradar is expressed as follows:
ΔPCEradar = 0.29Voc,0 + 0.28FF0 + 0.34PCE0.
Since all coefficients are positive, a device with a lower initial voltage Voc,0 ≈ 1.0 V yields a significantly lower standardized value, which mathematically translates into a lower predicted stability profile. In contrast, high-quality devices with Voc,0 ≈ 1.3 V fall into the highly stable cluster, retaining up to 94% of their initial efficiency.
Interestingly, other parameters such as shunt resistance (Rsh,0), short-circuit current (Jsc,0), and hysteresis index (HI0) exhibited weak correlations with p-values significantly exceeding 0.05. In particular, the positive sign for HI0 and the negative sign for series resistance (Rs,0) (r = −0.10, p = 0.51) align with physical expectations but lack statistical confidence in this dataset. These results imply that for the studied architecture, the ‘death’ of the PSC is primarily programmed by its initial ‘electronic health’, specifically the quality of its diode characteristics (Voc), rather than by parasitic resistances or early-stage ionic instability.
The positive correlation coefficient (r = 0.19) for the initial hysteresis index (HI0) seems counterintuitive, as hysteresis is typically associated with ionic instability. However, in our dataset, this trend is likely an indirect (concomitant) correlation. Higher HI0 values were predominantly observed in devices with superior initial Voc and PCE values. This suggests that in the pristine state, the presence of minor ionic displacement (reflected by HI0) is overshadowed by the high quality of the perovskite absorber and its well-passivated interfaces, which are the primary drivers of stability. Furthermore, the high p-value of 0.20 indicates that this correlation is statistically insignificant, suggesting that initial hysteresis in the observed range does not act as a decisive degradation predictor for this particular cell architecture.
An exploratory multiple linear regression analysis was conducted to determine the relative influence of pristine photovoltaic characteristics on the device’s long-term stability. Owing to the low coefficient of determination (R2 = 0.166), which underscores that long-term degradation kinetics are predominantly governed by stochastic pathways rather than deterministic initial states, this model serves solely as a qualitative screening tool rather than a predictive framework for precise quantitative lifetime estimation. Nevertheless, the formal regression framework and its associated statistical boundary conditions are provided in Online Supplementary Materials. Although the low R2 value might appear modest from a purely mathematical standpoint, it carries significant physical implications regarding perovskite stability. First, the low R2 indicates that only approximately 18% of the T80 variance is ‘pre-programmed’ by initial J–V characteristics. This confirms that degradation is predominantly a stochastic process driven by factors that evolve during aging. Second, despite the low R2, the model correctly identifies the trends and relative weights of primary stability descriptors. This establishes the ‘Stability Passport’ as a reliable tool for the qualitative screening and ranking of PSC devices. Third, unlike unencapsulated cells, where degradation is often driven by rapid external moisture ingress, our encapsulated devices are shielded from the atmosphere. Consequently, the low R2 highlights that even when external stressors are minimized, degradation kinetics remains governed by intrinsic processes, such as localized ion migration, the formation of interfacial voids or microscopic strain relaxation within the perovskite lattice. The fact that Voc,0 remains the dominant predictor even after encapsulation confirms that the initial quality of perovskite interfaces is the primary parameter determining PSC device stability.
To ensure the reproducibility of the multi-parameter diagnostic workflow, data processing, normalization and discrete time-step radar chart visualization were performed using a custom-developed automated Python pipeline, which is publicly available and archived in the permanent repository.[19]
To summarize, we have developed a robust approach for evaluating and predicting the long-term stability of PSC devices. Our results demonstrate that even with encapsulation, device stability remains finite, determined by internal electrochemical and physicochemical processes ‘pre-programmed’ at the time of fabrication. By employing a novel ‘fingerprinting’ approach based on radar charts, we visualized the multi-parameter evolution of PSCs and identified four distinct failure scenarios. These physical observations were formalized into a stability ‘passport’ generated using machine learning. The model confirms that the initial open-circuit voltage (Voc,0) and PCE0 are the dominant predictors of device lifetime. This implies that the initial electronic quality of the perovskite-contact interfaces determines the stability of the encapsulated device. The model also highlights the stochastic nature of intrinsic degradation (e.g., localized ion migration or the growth of interfacial voids). Nevertheless, the identified correlation between the pristine state and stability remains the most reliable tool for high-throughput screening. This investigation provides a definitive framework for predicting the shelf life of PSC devices.
This work was financially supported by the Russian Science Foundation (grant no. 24-73-00308). The authors acknowledge Lomonosov Moscow State University Program of Development regarding the use of the vacuum thermal evaporation unit.
Funders
References